Exploration & description/Milk offtake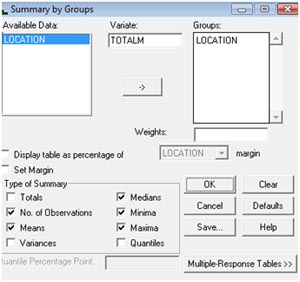 Descriptive and graphical methods provide a useful starting point for the analysis of the milk offtake data contained in CS1Data1. They help to reveal differences in the patterns of milk offtake between locations and the nature of associations between milk offtake and age of calf. Having converted LOCATION to a factor, general descriptive statistics can be produced by via Stats → Summary Statistics → Summaries of Groups (Tabulation). The means and medians in both locations are comparatively close indicating generally symmetric distributions. The range in milk offtake in Bilisa (LOCATION 1), however, is 5.2 litres per day compared with 1.8 litres per day in Assa (LOCATION 2).
|
![]()
![]()
![]()